
At the bottom of Maslow’s Hierarchy of Needs, you’ll find sleep - a vital physiological part of day-to-day life. Despite its importance, we don’t tend to think too much about it. That is, until we find ourselves struggling to drift off or waking up constantly throughout the night.
At Hillarys, we understand just how important restful shuteye is, which is why we have compiled plenty of facts about sleeping into this comprehensive report.
Our UK sleep statistics delve into everything snooze-related, including the average sleep time, the normal sleep pattern, the most common sleep disorders, and the correlation between poor sleep and mental health.
10 most interesting facts and stats about sleep
- Across all age groups, the average sleep time is between seven and eight hours. More info.
- Residents of New Zealand are the best-rested (07:27), while those in Japan are the least-rested (05:52). More info.
- Higher levels of activity during REM sleep - and associated higher heart rate - may explain why vulnerable adults are more prone to heart attacks during the early morning hours when REM sleep is most prevalent. More info.
- Nearly a third (32.19%) of adults still feel fairly tired when they wake up. More info.
- A fifth (20.52%) of adults rate their quality of sleep as fairly bad, compared to over half (55.84%) who rate it as fairly good. More info.
- More than half (52.73%) of UK adults would prefer to wake up between 07:45 and 09:45. More info.
- Repeated instances of poor sleep are three times more common in children with a probable mental disorder than in those without (76.5% vs 25%). More info.
- One in six (16.92%) of UK adults have struggled with symptoms of insomnia for more than 10 years. More info.
- One in 15 adults admits to napping every day. More info.
- Residents in Manchester are the most worried about sleep, according to a unique study by Hillarys. More info.
Average sleep statistics
Average sleep time by age
The latest sleep duration statistics show that, across all age groups, the most common average sleep duration is between seven and eight hours.
Across these age groups, the following proportion of adults get between seven and eight hours of sleep per night:
- 18-25: 56.3%
- 26-40: 53.9%
- 41-50: 50.6%
- 51-65: 47.3%
- 65+: 42.2%
Average sleep time by age
This table breaks down sleep duration across different age groups.

| Age group | Total sleep time | ||||
|---|---|---|---|---|---|
| <6 hours | 6–7 hours | 7–8 hours | 8–9 hours | >9 hours | |
| 18-25 | 0.30% | 13.90% | 56.30% | 25% | 5% |
| 26-40 | 0.90% | 22.20% | 53.90% | 20.10% | 2.90% |
| 41-50 | 1.80% | 27.20% | 50.60% | 17.30% | 3.10% |
| 51-65 | 3% | 29.20% | 47.30% | 17.20% | 3.60% |
| 65+ | 4.00% | 25.20% | 42.20% | 21.80% | 6.80% |
Figures may exceed 100% due to rounding.
(Source: Scott et al. via ScienceDirect)
Though this is the most common average sleep duration, there are disparities in the proportion that denotes a majority. While nearly three-fifths of 18-25-year-olds sleep between seven and eight hours each night, only just over two-fifths of those aged 65 and over get the same hours of rest.
The second most common average sleep duration is six to seven hours for all age groups except the youngest. Those aged 18-25 are more likely to sleep for eight to nine hours (25%) than six to seven hours (13.9%).
Average sleep time by country
Global sleep duration statistics for 2025 reveal that residents of New Zealand are the most-rested, recording an average of seven hours and 27 minutes in bed. With a typical bedtime of 23:29, New Zealanders go to sleep earlier than their fellow top 10 most rested countries.
Top 10 countries with the greatest average time in bed
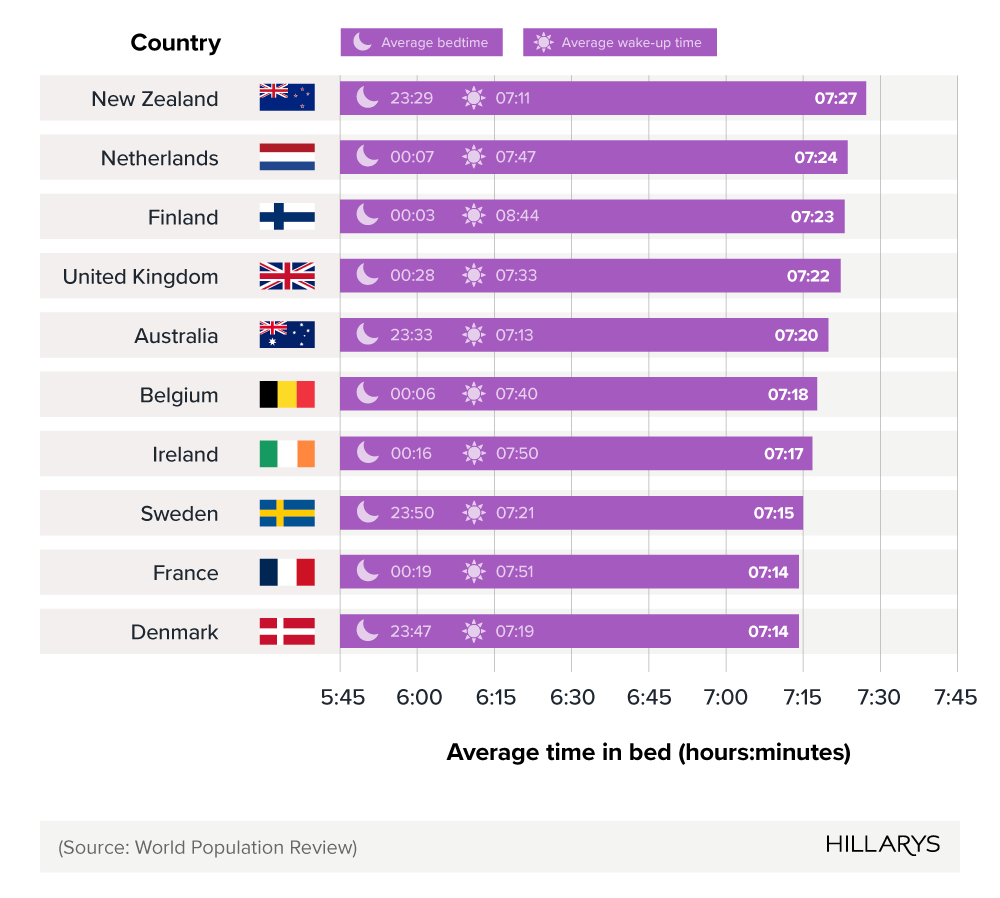
Closest neighbour Australia also ranks within the top 10, with its residents recording an average of seven hours and 20 minutes in bed each night. Outside these two Southern Hemisphere countries, the other eight most-rested nations are all situated in Europe.
Residents of the United Kingdom are the fourth-most rested in the world. With an average bedtime of 00:28, residents typically rack up seven hours and 22 minutes in bed each night.
Top 10 countries with the lowest average time in bed
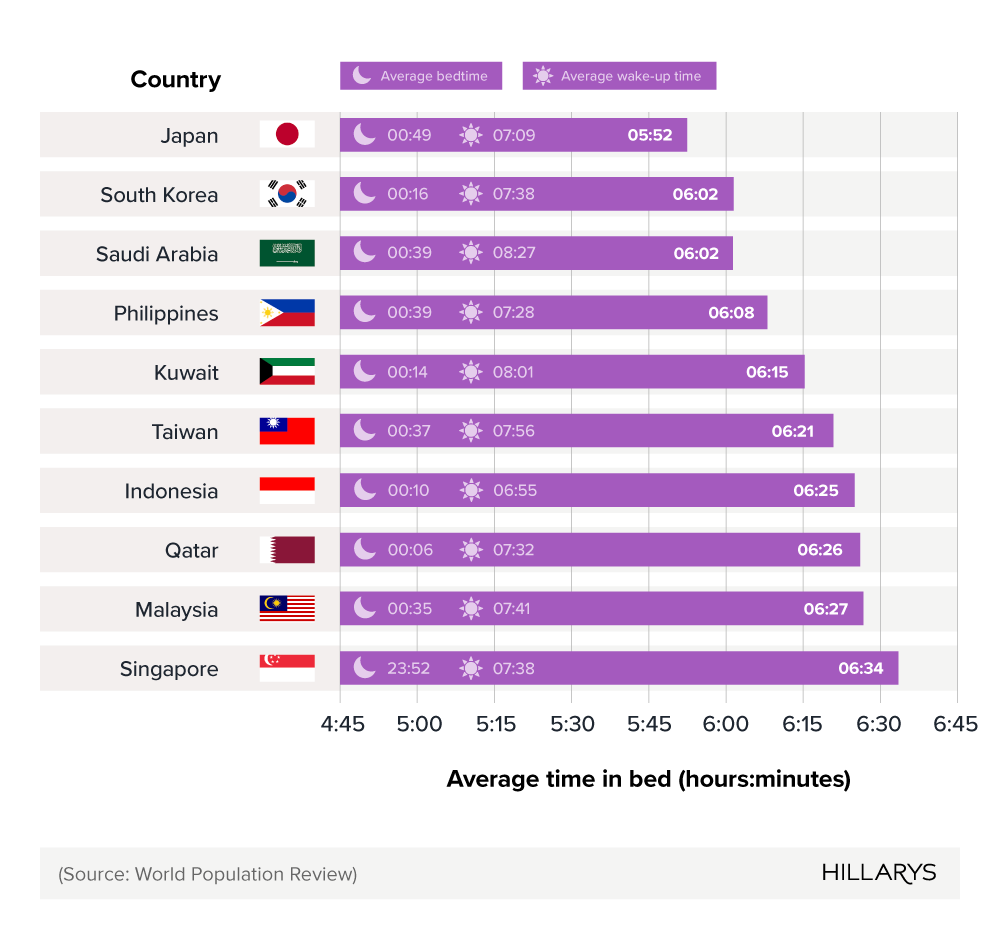
On the other hand, the least-rested nation in the world is Japan. Residents of this country don’t typically go to bed until nearly 01:00 and rise just after 07:00, giving them just five hours and 52 minutes in bed, on average.
All of the top 10 least-rested countries are situated across the Asian continent.
Average sleep cycle
The average sleep cycle lasts between 90 and 110 minutes and is repeated four to five times each night. During this cycle, you experience two types of sleep: One stage of rapid eye movement (REM) sleep, and three stages of non-rapid eye movement sleep (NREM). NREM is then broken down into three stages: light (N1), deep (N2), and deeper (N3).
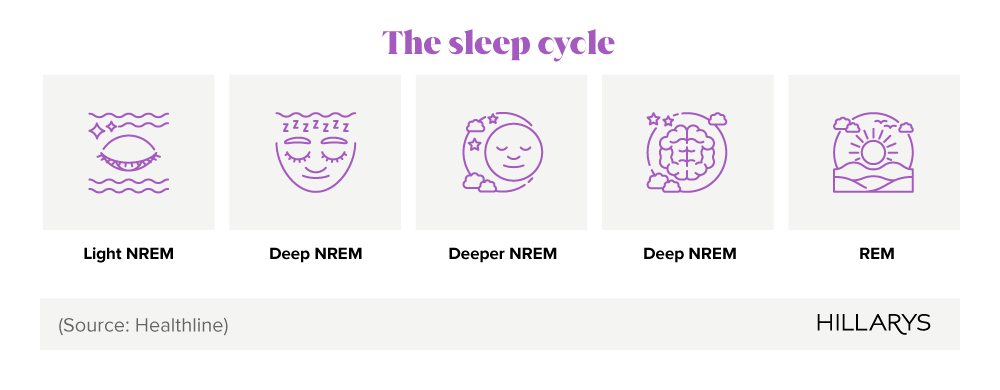
The average REM sleep you achieve each night gradually increases. Initially, the REM stage will be short, at around 10 minutes, but as the night progresses, REM becomes longer than NREM sleep.
Hillarys’ sleep calculator uses 90-minute cycles to determine the best time to wake up.
Average heart rate during sleep
During the day, adults have an average resting heart rate between 60 and 100 beats per minute (bpm). When sleeping, this slows to an average of 40 to 50bpm. Typically, the heart rate slows during non-rapid eye movement sleep and rises during REM sleep.
According to research quoted by the Sleep Foundation, the higher heart rate activity seen during REM sleep may explain why already vulnerable adults often experience heart attacks and other cardiovascular events during the early morning hours - the period typically spent in REM sleep.
Sleep quality statistics
Do adults feel well-rested when they wake up?
Sleep is vital for helping us feel well-rested and ready to face a new day. However, according to the UK Biobank’s survey, just one in 10 (10.2%) of adults feel very refreshed upon waking.
How respondents feel after waking
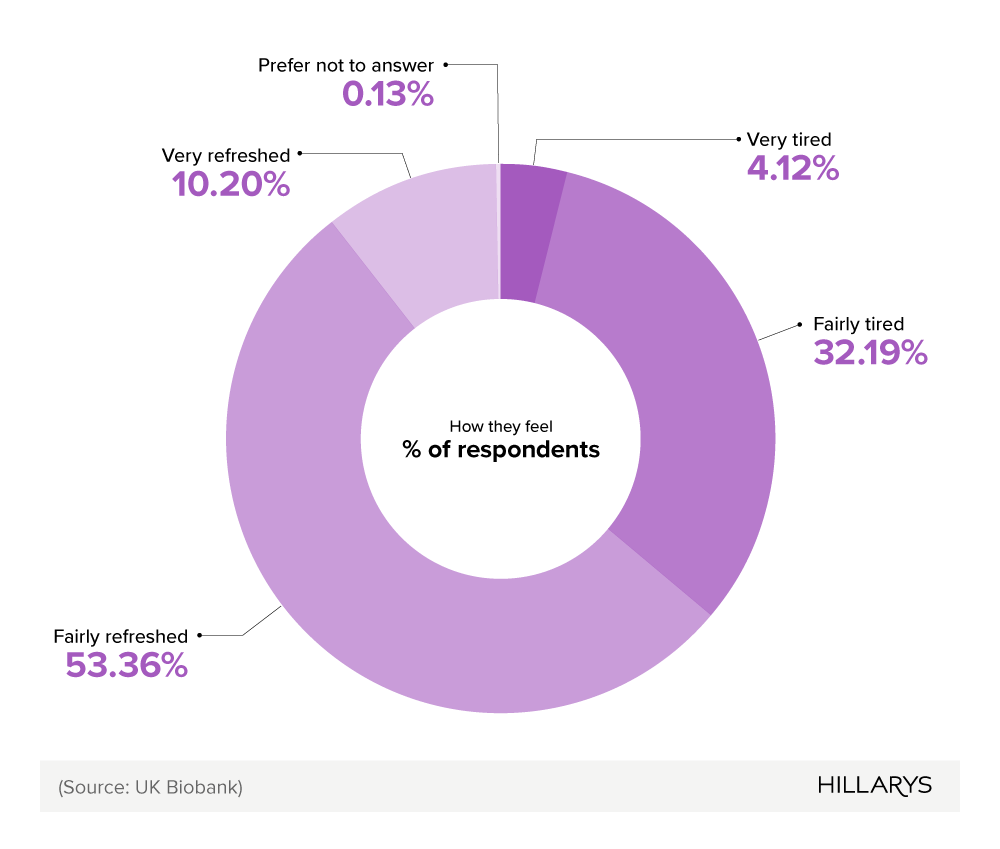
While over half (53.36%) of respondents feel fairly refreshed after a night's sleep, nearly a third (32.19%) report still feeling fairly tired. A further one in 20 (4.12%) adults feel very tired, suggesting they are either not getting enough sleep or not getting quality sleep.
How do adults perceive their quality of sleep?
In terms of the quality of one’s sleep, well over half (55.84%) of adults would categorise their sleep as fairly good.
How respondents perceive their quality of sleep
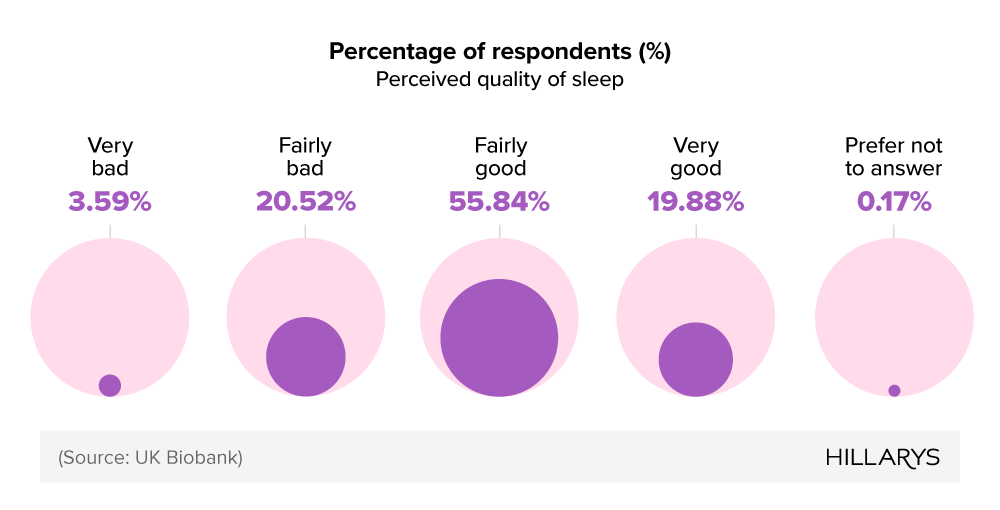
However, a fifth (20.52%) of adults believe their sleep is of fairly bad quality, narrowly beating out the 19.88% of adults who class their sleep as very good.
A small, but not insignificant, group of adults categorise their quality of sleep as very bad (3.59%).
What is the best time to wake up?
Using Hillarys’ sleep calculator, you can determine the best time to wake up, based on the knowledge that you will feel more refreshed if you wake up in between 90-minute cycles.
Over half (52.73%) of respondents to the UK Biobank survey answered that their ideal wake-up time is between 07:45 and 09:45.
What time respondents would prefer to wake up
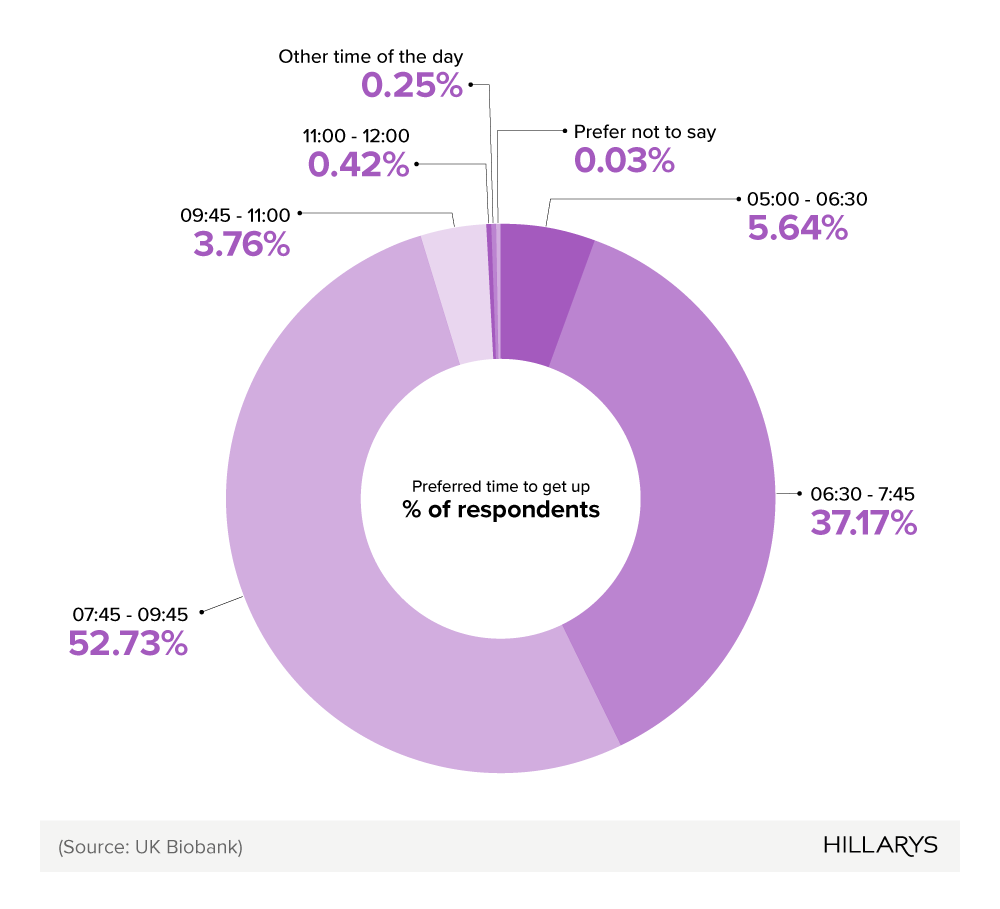
Interestingly, the next most popular answer provided was between 06:30 and 07:45, with nearly two-fifths of respondents choosing an earlier wake-up call, even without the pressure of work or kids.
Unique data: Which British cities are most worried about sleep?
In a bid to find out which British cities’ residents are the most stressed about their sleep, Hillarys has created the ultimate Sleep Concern Index. Residents in Manchester are the most worried about their sleep quality and habits, scoring 9.55/10.
Sleep Concern Index - which cities’ residents are most worried about sleep?
This table ranks British cities by their 'sleep concern score'.

| City | General sleep topics | Sleep disorders | Tiredness and fatigue | Lifestyle and hygiene | Sleep concern score (out of 10) |
|---|---|---|---|---|---|
| Manchester | 1,0327 | 2,700 | 1,760 | 1,153 | 9.55 |
| Leeds | 896 | 2,083 | 1,371 | 949 | 8.98 |
| Birmingham | 792 | 1,865 | 1,475 | 780 | 8.75 |
| Glasgow | 609 | 1,359 | 913 | 710 | 8.07 |
| Edinburgh | 568 | 1,290 | 955 | 594 | 7.73 |
| London | 497 | 1,299 | 800 | 576 | 7.05 |
| Coventry | 534 | 1,035 | 868 | 568 | 6.93 |
| Bristol | 505 | 1,186 | 778 | 505 | 6.59 |
| Kingston upon Hull | 382 | 841 | 726 | 497 | 5.91 |
| Stoke-on-Trent | 322 | 515 | 676 | 451 | 5.34 |
(Source: Hillarys)
Residents in Manchester are the most likely to be worried about sleep disorders and related medical concerns, with keywords in this category racking up over 2,700 searches per 100,000 residents.
Along with Manchester, the Brits most concerned about sleep also hail from:
- Leeds (8.98/10)
- Birmingham (8.75/10)
- Glasgow (8.07/10)
- Edinburgh (7.73/10)
At the other end of the scale, residents in Nottingham are the least likely to be concerned about their sleeping habits, with a score of just 0.45/10. Those located in Nottingham are the least likely to make searches across all four of the key sleep concern categories.
Impact of light on sleep
One in 15 (6.69%) UK adults report being occasionally disturbed by light levels when trying to sleep, which can cause one’s circadian rhythm to become misaligned with the night and day schedule.
How often have respondents had their sleep disturbed by light levels
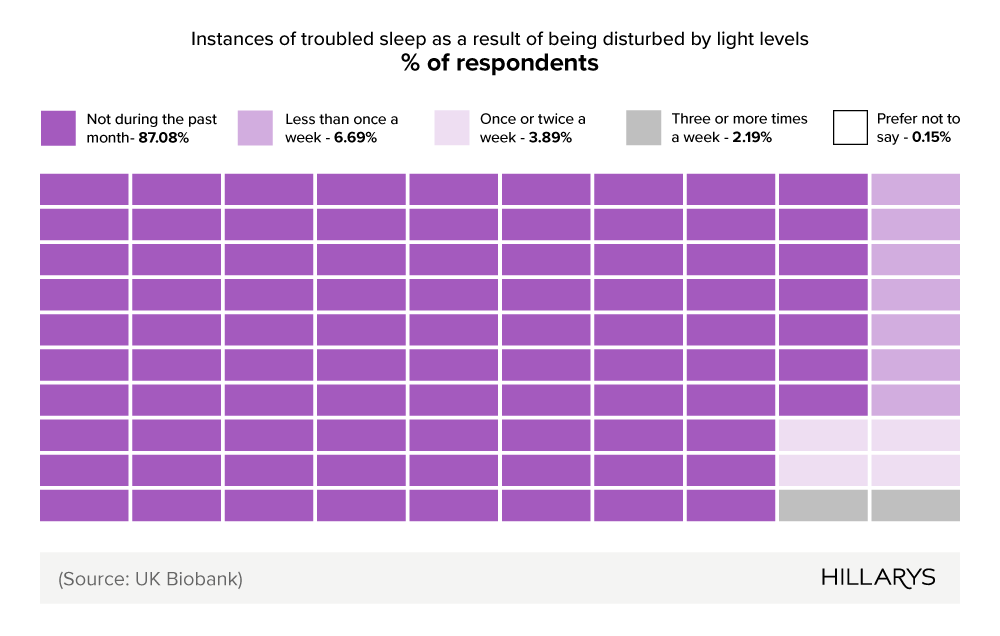
While the majority (87.08%) of UK adults find their bedrooms adequately dark enough, a not insignificant 3.89% are disturbed by light levels once or twice a week.
According to a Hillarys survey, three-quarters of those who have had thermal/blackout window furnishings fitted report better sleep since installation, highlighting the importance of light and temperature control in the bedroom.
One of the facets of good sleep hygiene is ensuring your bedroom is as dark as possible. Make use of blackout blinds or shutters to create the ideal environment for some quality shut-eye.
Poor sleep and young people’s mental health
The latest statistics from NHS England reveal that over a third (37.8%) of children aged eight to 16 and over two-thirds of young people aged 17–23 (64.9%) had problems with sleeping three or more nights in the past week.
Percentage of young people with sleep problems, by mental health status
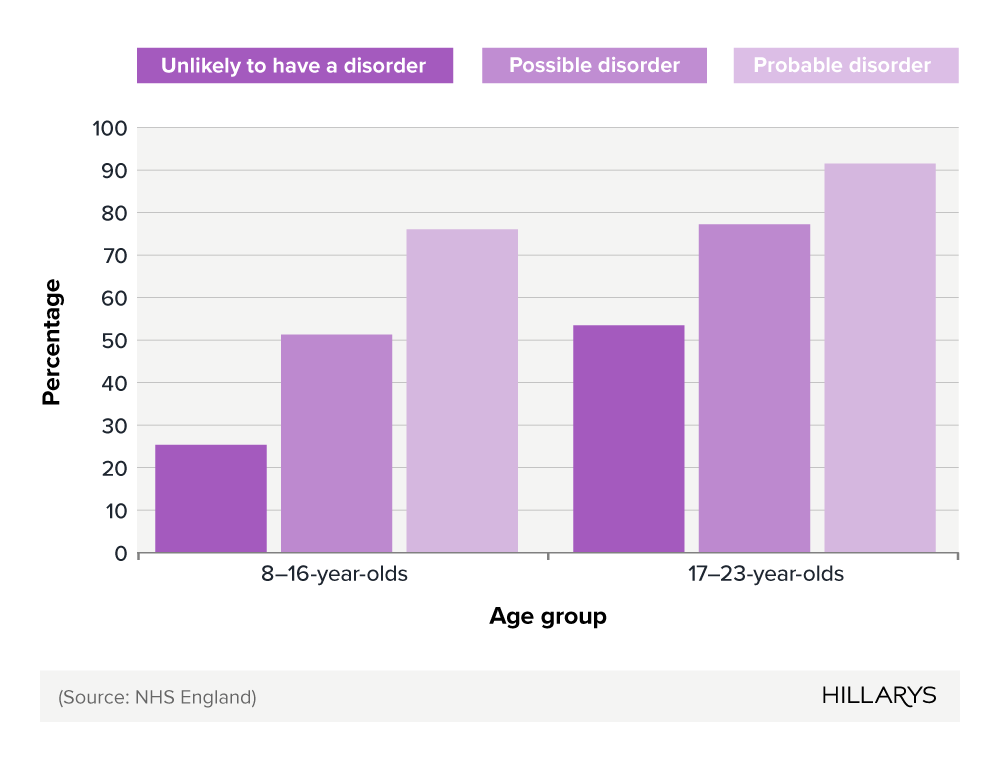
| Age Group | Unlikely to have a disorder | Possible disorder | Probable disorder |
|---|---|---|---|
| 8–16-year-olds | 25% | 52% | 76.5% |
| 17–23-year-olds | 52.9% | 77% | 91.4% |
(Source: NHS England)
Within both age groups, children and young people are far more likely to have struggled with sleep if they had a probable mental disorder than those unlikely to have a disorder.
Among children, more than three-quarters (76.5%) of those with a probable disorder struggled with sleep over three or more nights, compared to one quarter (25%) without a disorder. Similarly, among young adults, nine in 10 (91.4%) of those with a probable disorder experienced difficulties compared to just over half (52.9%) of those without.
Sleep disorders statistics
Insomnia statistics
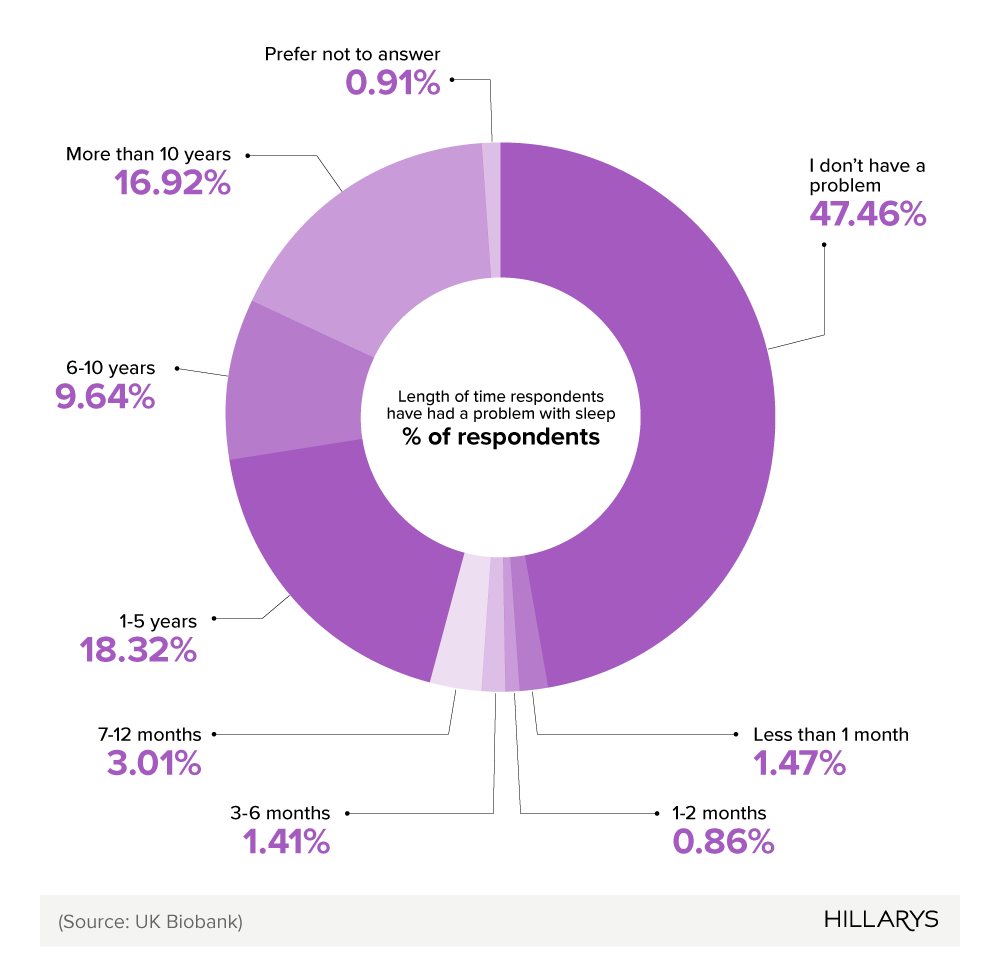
Insomnia is one of the most common sleep disorders, and one in six (16.92%) UK adults report suffering from the condition for more than 10 years.
Length of time adults have had a problem with sleep
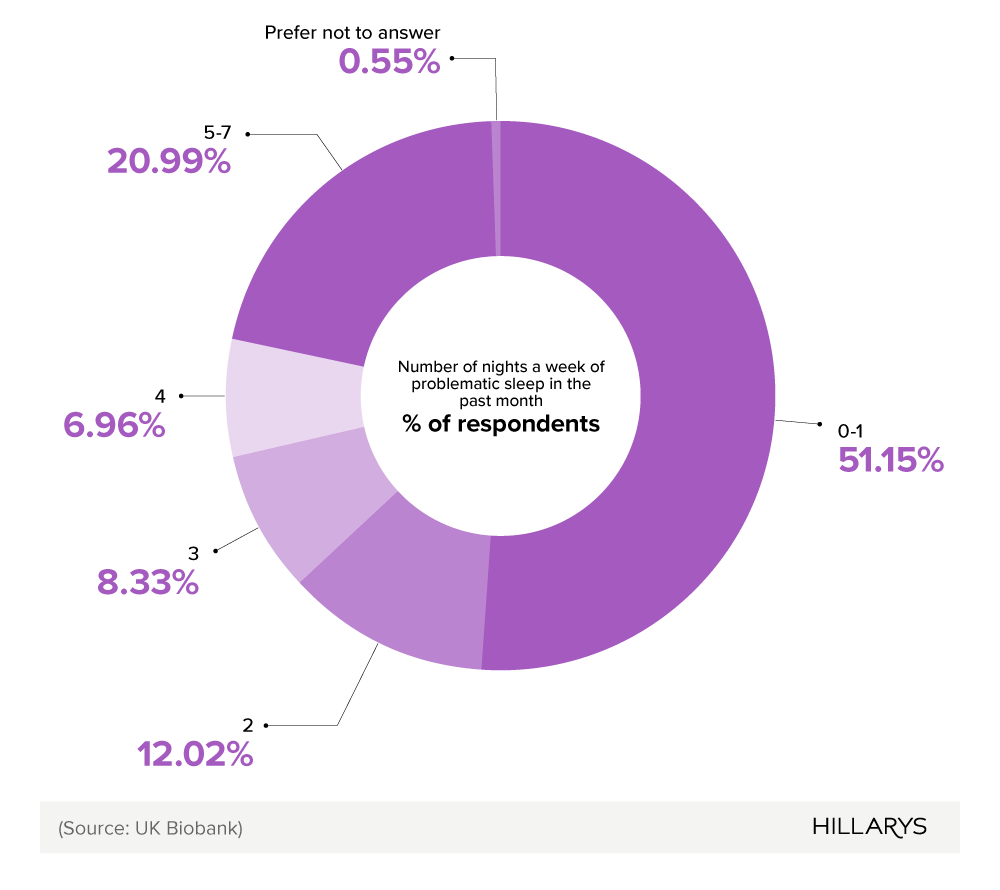
Number of times a week adults have experienced problematic sleep in the past month
How many people have sleep apnoea?
The Sleep Apnoea Trust states that there are ‘no accurately researched and peer-reviewed estimates’ of the number of people with obstructive sleep apnoea (OSA) in the UK. However, in 2015, the British Lung Foundation suggested there were an estimated 1.5 million adults in the UK with OSA, with up to 85% undiagnosed.
Nap statistics
How often do adults nap?
According to the latest nap statistics, just over three in 10 (31.32%) UK adults report napping during the daytime 1–2 times during the past month.
Number of times adults have napped during the day in the past month
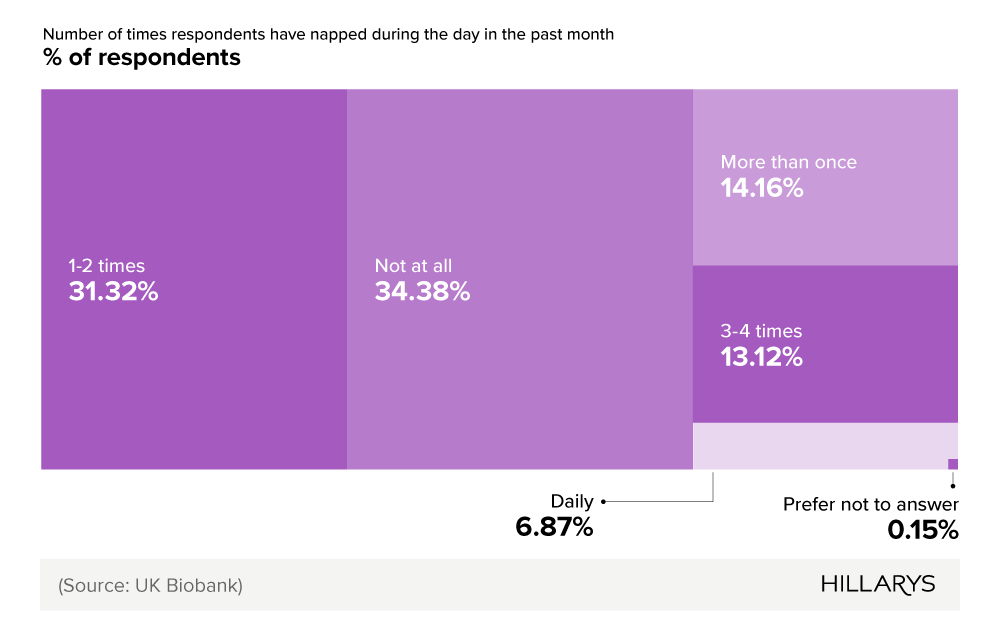
One in seven adults (14.16%) state they nap more than once a week, while one in 15 (6.87%) admit to napping every day.
Three-fifths (63.37%) more adults nap at least once a month than those who don't (65.47% vs 34.38%).
How long do people nap for on average?
Among those who nap, the most common nap duration is between 0 and 20 minutes, with over half (52.17%) of respondents stating this is their typical duration.
Typical duration of daytime naps
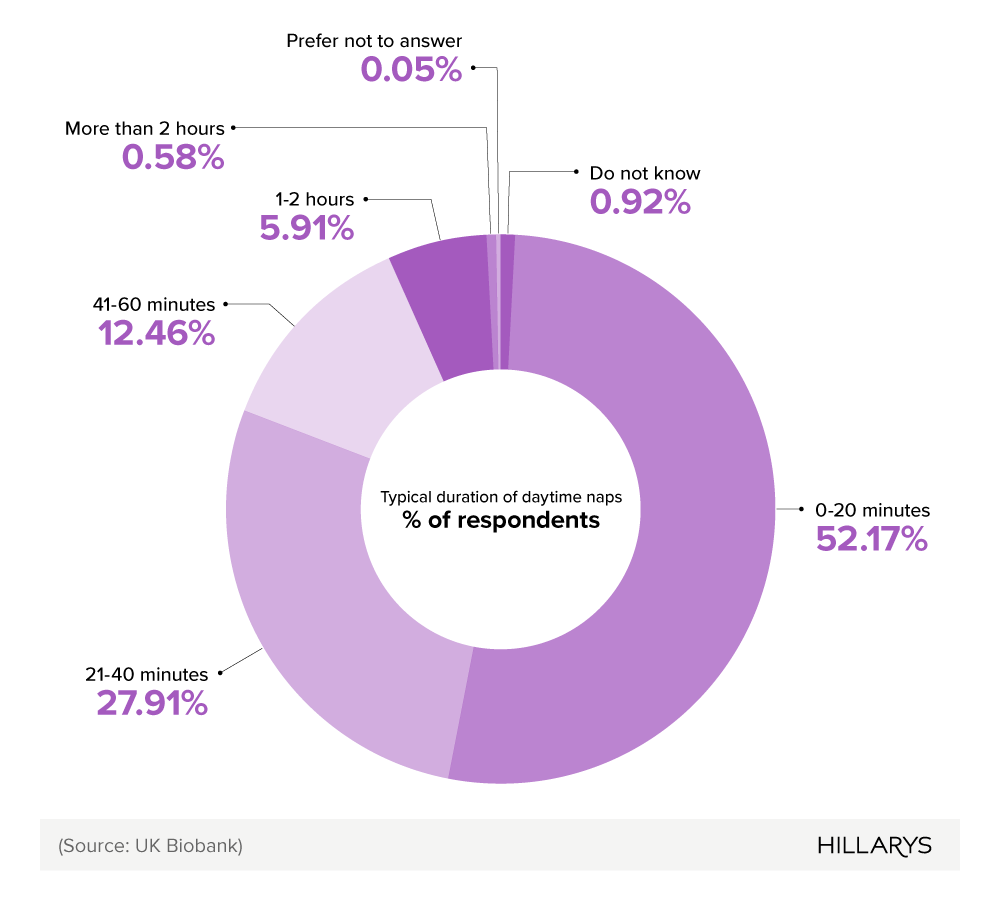
Just under three in 10 (27.91%) daytime nappers typically sleep for between 21 and 40 minutes, while over a tenth (12.46%) prefer a full hour (41–60 minutes) for their midday nap.
One in 17 (5.91%) adults admits to napping for one to two hours.
Typical duration of daytime naps
FAQs
Why do we sleep?
Sleep is essential for physical and mental health. It helps the body repair tissues, grow muscle, process hormones, and maintain a strong immune system. It also supports vital brain function by consolidating memories, supporting emotional regulation, and enhancing cognitive functions like problem-solving.
How many hours should I sleep?
It’s recommended that adults get between seven and nine hours of sleep, with this figure dropping to seven to eight hours for those aged 65 and over.
Do women need more sleep than men?
While there is no definitive answer, the Sleep Foundation suggests that research indicates women typically sleep 11 minutes more than men. Hormonal fluctuations can impact sleep patterns and increase sleep needs. They also report that women are 40% more likely to experience insomnia and twice as likely to have restless legs syndrome.
How much do newborns sleep?
According to the NHS, most newborns are asleep for more time than they are awake, typically getting around 18 hours of sleep a day.
What is sleep hygiene?
Sleep hygiene refers to a set of healthy habits and environmental factors that support good quality sleep. The Sleep Foundation recommends behaviours like:
- Keeping your bedroom dark, cool, and quiet.
- Avoiding electronic devices for at least 30–60 minutes before bedtime.
- Sticking to a consistent sleep schedule.
- Restricting in-bed activity to only sleeping (and sex).
How to improve sleep quality
To improve sleep quality, establish a consistent sleep schedule and follow the principles of good sleep hygiene. Create a calming bedroom environment and ensure it is dark. The use of blackout blinds ensures that you will not be woken up by light.
What's sleep apnoea?
Sleep apnoea (or apnea) is a common sleep disorder where breathing repeatedly stops and starts during sleep. This leads to fragmented, poor-quality sleep and can result in snoring, daytime fatigue, and an increased risk of serious health conditions like heart disease and stroke.
Sources and methodology
Sources
- https://www.hillarys.co.uk/static/sleep-calculator/
- https://www.hillarys.co.uk/the-sleepiest-nations/
- https://www.sciencedirect.com/science/article/pii/S235272182300253X
- https://worldpopulationreview.com/country-rankings/average-sleep-time-by-country
- https://ouraring.com/blog/sleeping-heart-rate-by-age/
- https://www.healthline.com/health/how-much-deep-sleep-do-you-need
- https://biobank.ndph.ox.ac.uk/ukb/label.cgi?id=205
- https://pmc.ncbi.nlm.nih.gov/articles/PMC10105495/
- https://www.sleepfoundation.org/sleep-hygiene
- https://digital.nhs.uk/.../part-2-sleep-loneliness-activities-and-health-behaviours
- https://cks.nice.org.uk/topics/insomnia/background-information/prevalence/
- https://sleep-apnoea-trust.org/research/
Hillarys’ sleep concern index
Hillarys wanted to find out which cities’ residents are the most worried about their sleep quality and habits. For this study, only cities with a population of over 300,000 were used.
To do this, they created four main concern categories:
- General sleep topics (such as ‘how much sleep do I need?’)
- Sleep disorders and medical concerns (such as ‘insomnia treatment’)
- Tiredness and fatigue (such as ‘why am I always tired?’)
- Lifestyle and sleep hygiene (such as ‘best temperature for sleep’)
Then, the following steps were taken:
- Using Google Adwords Keyword Planner, Hillarys determined the average monthly search volumes for each category in each city.
- These figures were then calculated into average annual search per 100,000 population.
- Finally, a percentrank formula was used to assign each city an overall sleep concern score.
Sources: Ahrefs, Google Adwords Keyword Planner, https://worldpopulationreview.com/cities/united-kingdom